A quick start
Script that demonstrates some of the main functionalities of the nnsa package for analyzing EEG data.
Link to script: a_quick_start.py
import os

import matplotlib.pyplot as plt

from nnsa import EdfReader, NotchIIR, Butterworth
from nnsa.containers.datasets import DEFAULT_EEG_CHANNELS, EegDataset
from nnsa.utils.dummy_data import generate_eeg
Define a filepath to an edf file on you PC that you want to read (include the file extension).
# Specify path to an EDF(+) file (pick a short recording to make this example code faster). You
# can also set it to None to generate mock data.
filepath = 'C:/data_temp/test.edf'
Load data or create mock-data is file cannot be found.
if filepath is not None and os.path.exists(filepath):
    # Read EEG from EDF.
    print('Reading EDF...')
    with EdfReader(filepath) as r:
        eeg_ds = r.read_eeg_dataset()
    # Get the sampling frequency.
    fs = eeg_ds.fs

else:
    # Create mock-data (not representative for any EEG).
    print('Generating mock data...')
    fs = 250
    eeg = [generate_eeg(fs=fs, duration=300, seed=ii) for ii in range(len(DEFAULT_EEG_CHANNELS))]
    eeg_ds = EegDataset.from_array(eeg, fs=fs, channel_labels=DEFAULT_EEG_CHANNELS)
Plot the raw EEG data.
fig = plt.figure(tight_layout=True)
eeg_ds.plot()
plt.title('Raw EEG')

We can apply common preprocessing to the EEG data using methods of the EegDataset class. First, let us extract the 8 default channels (Fp1, Fp2, C3, C4, Cz, T3, T4, O1, O2) and (re-)reference the EEG to Cz.
eeg_ds = eeg_ds.extract_default_channels().reference('Cz')
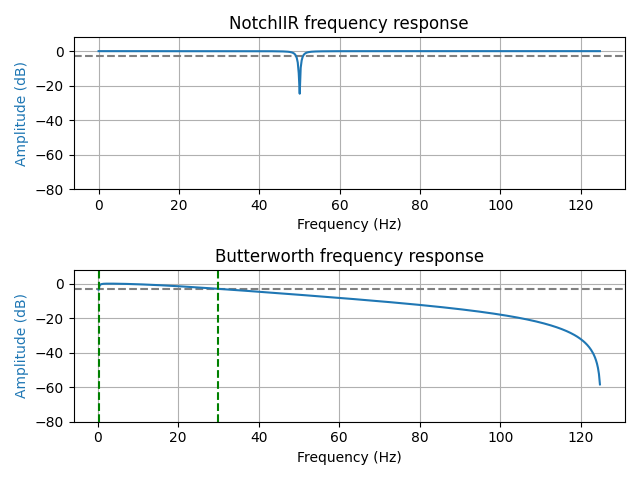
Next, let’s define some filters. We can use nnsa filter classes for this (see https://nnsa.readthedocs.io/en/latest/nnsa.preprocessing.html#module-nnsa.preprocessing.filter)
# Notch filter for power line.
notch_filt = NotchIIR(f0=50, fs=fs)

# Bandpass filter.
bp_filt = Butterworth(fn=[0.27, 30], order=1, fs=fs)

# We can plot the filter responses easily using the created filter instances.
fig, axes = plt.subplots(2, 1, tight_layout=True)
notch_filt.plot_frequency_response(angle=False, ax=axes[0])
bp_filt.plot_frequency_response(angle=False, ax=axes[1])
We can apply these filters to the EEG in a single line and add some downsampling, too. Note the difference between the methods for zero-phase filtering (.filtfilt) and regular filtering (.filter).
eeg_ds_pp = eeg_ds.filtfilt(notch_filt).filter(bp_filt).resample(method='polyphase_filtering', fs_new=128)

# Plot the preprocessed EEG.
fig = plt.figure(tight_layout=True)
eeg_ds_pp.plot()
plt.title('Preprocessed')

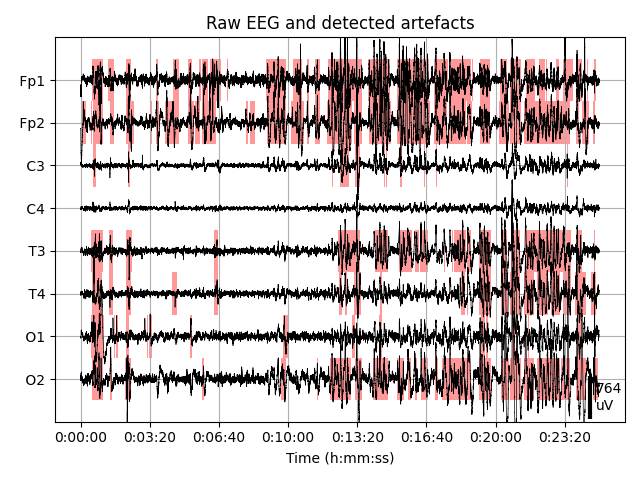
We can apply automated artefact detection (see also https://nnsa.readthedocs.io/en/latest/examples.artefacts.html)
# Detect the artefacts by calling this method directly on the unfiltered data (see the docs of the funtion).
af_mask_ds = eeg_ds.detect_artefacts(multi_channel_cnn=False, verbose=1)

# Plot raw EEG and a mask indicating the artefacts.
fig, ax = plt.subplots(1, 1, tight_layout=True)
eeg_ds.plot(ax=ax, color='k')
eeg_ds.plot_mask(mask=af_mask_ds, color='r')
ax.set_title('Raw EEG and detected artefacts')
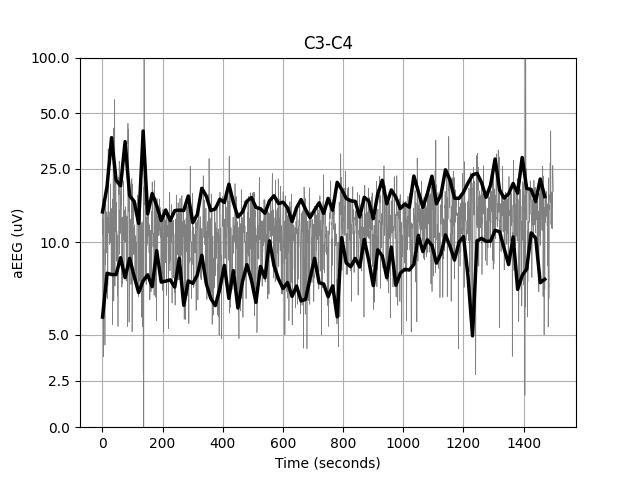
We can also emulate amplitude-integrated EEG (aEEG) from the continuous EEG.
# Create the desired derivation.
eeg_ts = eeg_ds.create_bipolar_channel(channel_1='C3', channel_2='C4')

# Compute aEEG.
result_aeeg = eeg_ts.amplitude_eeg()

# Plot.
plt.figure(tight_layout=True)
result_aeeg.plot()
The EegDataset class contains many more built-in analyses, including spectral power analysis, burst detection, multi-scale entropy, sleep and functional brain age. For this see the examples: https://nnsa.readthedocs.io/en/latest/examples.feature_extraction.html. Alternatively, you may browse the methods of EegDataset: https://nnsa.readthedocs.io/en/latest/nnsa.containers.html#nnsa.containers.datasets.EegDataset
For example, we can easily do a multi scale entropy (MSE) analysis.
# Run multi_scale_entropy.
result_mse = eeg_ds_pp.multi_scale_entropy()

# Plot the result.
result_mse.plot(segments=[1], plot_fit=True)

The EegDataset class contains various built-in analyses, including spectral power analysis, burst detection, multi-scale entropy, sleep and functional brain age. For this see the examples: https://nnsa.readthedocs.io/en/latest/examples.feature_extraction.html. Alternatively, you may browse the methods of EegDataset: https://nnsa.readthedocs.io/en/latest/nnsa.containers.html#nnsa.containers.datasets.EegDataset